
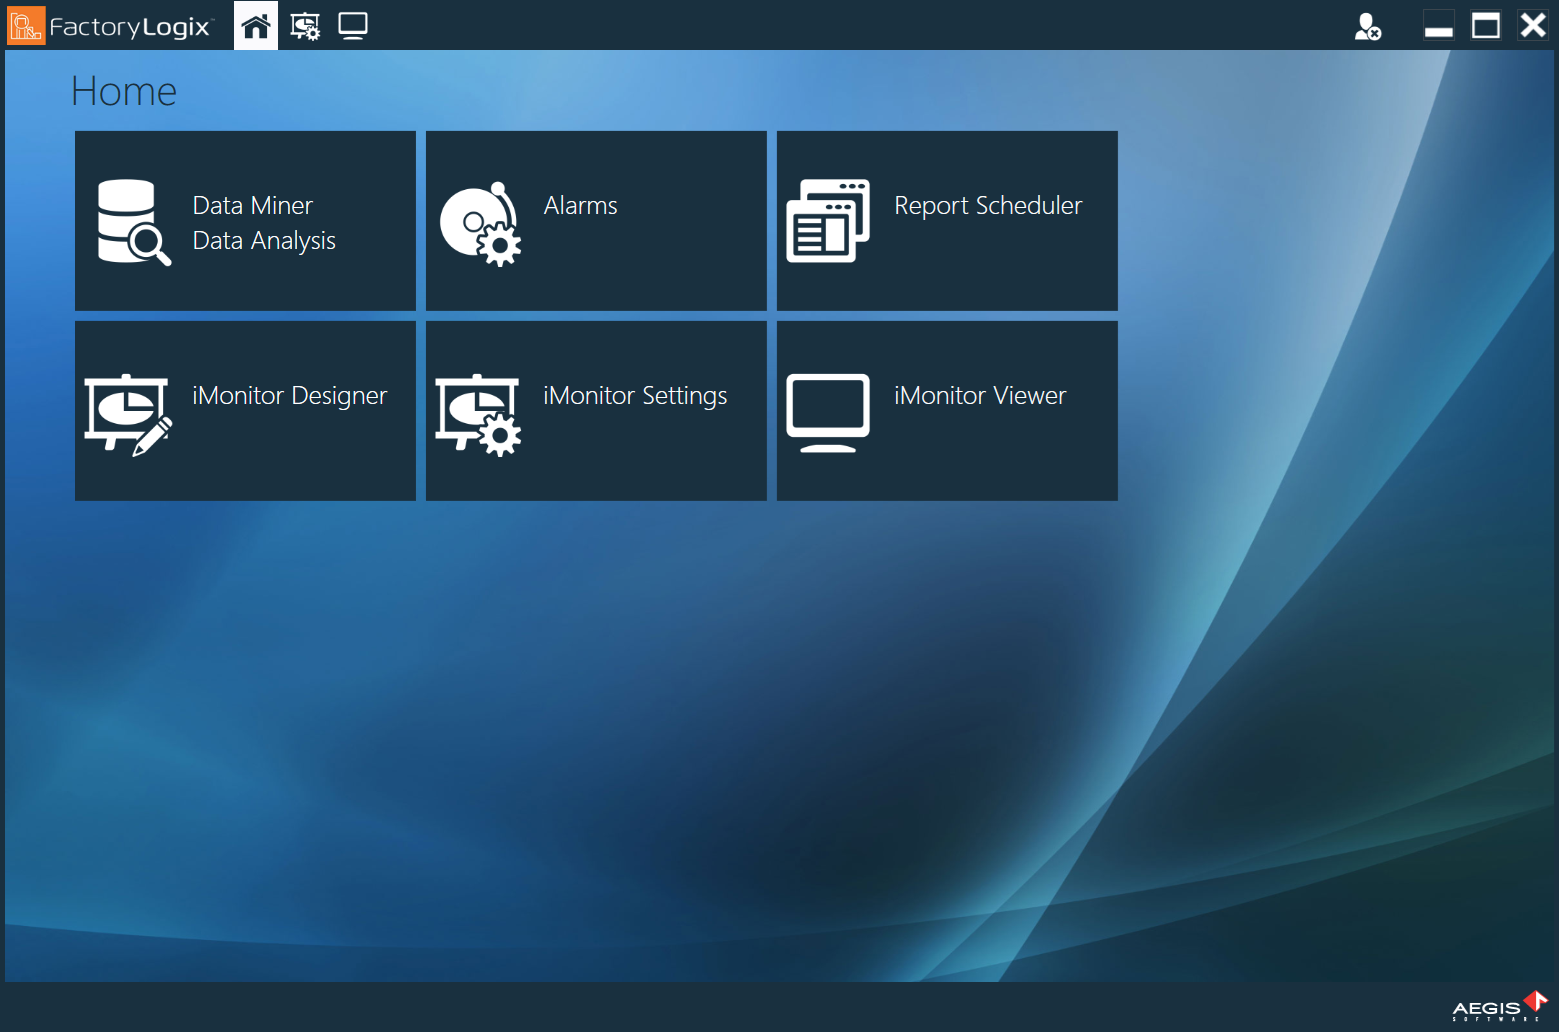
The FactoryLogix Analytics Home window has six main areas. See the following table for a description of each area and its purpose.
Note
FactoryLogix Online does not support the FactoryLogix Analytics iMonitor functionality. If you want to create dashboards in FactoryLogix Online, use the FactoryLogix Website Analytics features. See Use Analytics for detailed information.
|
Analytics area |
Purpose |
|---|---|
|
DataMiner/Data Analysis |
Select data sources and create historical reports, pivot tables, and charts for data analysis. |
|
Alarms |
Configure automated reports based on criteria you specify. For example, you can create an alarm to notify management when the assembly yield falls below a specified level. |
|
Report Scheduler |
Configure reports to run automatically at predetermined intervals. |
|
iMonitor Designer |
Create robust, real-time dashboards with data that provides instant visibility into what is happening on the factory floor. |
|
iMonitor Settings |
Configure the actual production run times used in Overall Equipment Effectiveness (OEE) calculations. |
|
iMonitor Viewer |
View real-time dashboards created in iMonitor Designer. |