MES Onboarding Progress
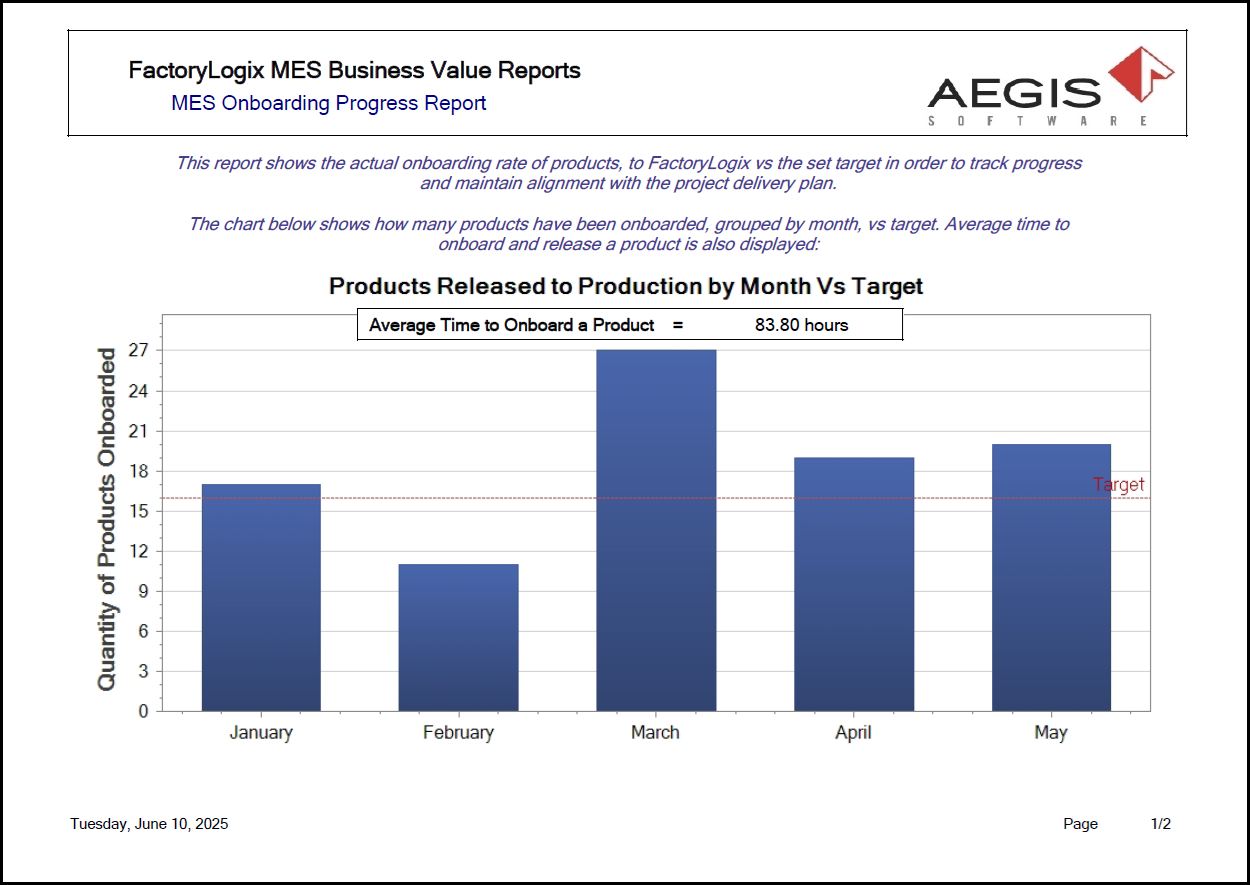
Use the MES Onboarding Progress report to show the actual onboarding rate of products versus the set target, allowing you to track progress and maintain alignment with your product delivery plan.
The following example shows how many product were onboarded versus the target (by month); the average time to onboard and release a product is shown below the chart title.
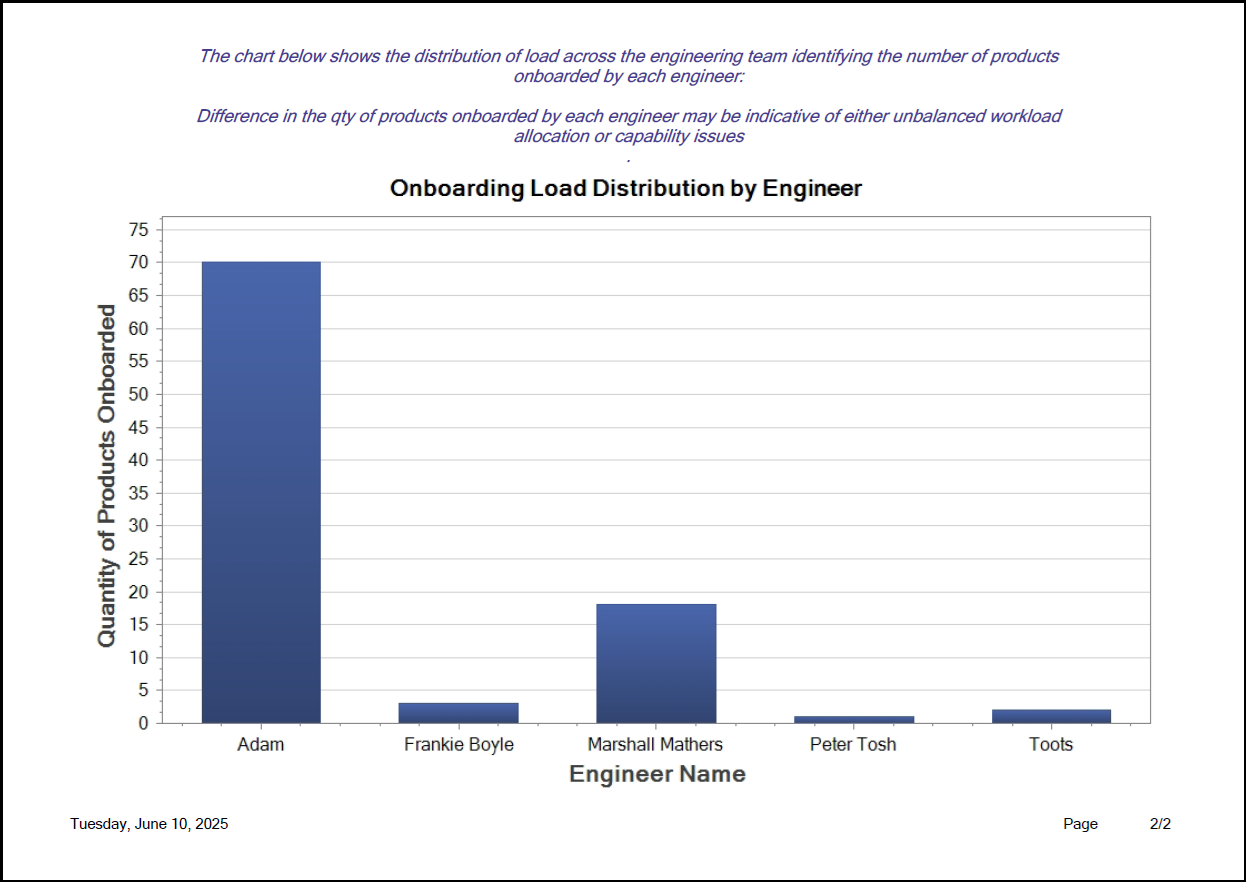
The following example shows the distribution load across the Engineering team and the number of product onboarded by each engineer. The difference between the product quantity onboarded by each engineer may indicate either an unbalanced workload allocation or capability issues.