
administrator on-premise only
To conduct a detailed performance investigation, you’ll need to provide the information outlined in this topic when submitting information to Aegis Technical Support. Providing complete information will significantly reduce the time required to diagnose and resolve performance problems!
Please collect the following data and add it to the Data collection worksheet before submitting to Aegis Technical Support:
Current SQL version
To obtain the version of SQL Server that is installed, run the following commandin SMSS: Select @@version
Current maintenance plan information
Please provide the following information to Aegis:
-
Screenshots or an export of the maintenance plan
-
Schedule frequency
-
Included maintenance tasks
Current database health
Please run the following script in SMSS and save the results as a csv exporting with headers. The script is also embedded at the end of this document. Getting the database health check is a non-intrusive process. So, this can be done while the production line is operating. A larger database can take several minutes to run. When complete save the results as a csv with headers.
SELECT t.name AS [Table], i.name AS [Index], ddips.avg_fragmentation_in_percent AS [Fragmentation], ddips.page_count AS [Page Count],(SELECT TOP 1 rowcnt FROM sysindexes si WHERE si.id = i.object_id) AS [Row Count], STATS_DATE(i.object_id, i.index_id) AS [Statistics Date] FROM sys.dm_db_index_physical_stats (DB_ID(), NULL, NULL, NULL, NULL) AS ddips INNER JOIN sys.tables t ON t.object_id = ddips.object_id INNER JOIN sys.indexes i ON i.object_id = ddips.object_id AND ddips.index_id = i.index_id WHERE ddips.database_id = DB_ID() AND i.name IS NOT NULL --AND ddips.avg_fragmentation_in_percent > 0 --AND t.name IN ('') ORDER BY ddips.avg_fragmentation_in_percent DESC
Check daily transactions
Execute the following SQL script in SSMS to return a report of the number of daily transactions. Save this out as a csv with headers:
select CAST(TimeCompleted_BaseDateTimeUTC as date) as [DAY], COUNT(ID)from ProductRouteTransactions WHERE CAST(TimeCompleted_BaseDateTimeUTC as date) >=dateadd(day,datediff(day,0,GetDate())- 30,0) GROUP BY CAST(TimeCompleted_BaseDateTimeUTC as date) order by CAST(TimeCompleted_BaseDateTimeUTC as date)
Gather disk read/write performance and IOPS
Using a tool such as Crystal Disk Mark or similar you can collect the read and write information about the hard drives. Hard drives that contain the Windows operating system and data files should be tested. After each test, take a screenshot of the results as shown in the following example:
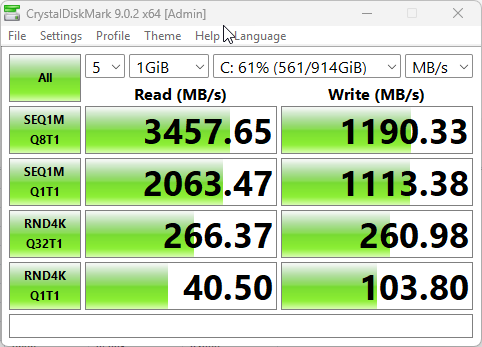
Crystal Disk Mark is also capable of reporting the IOPS:
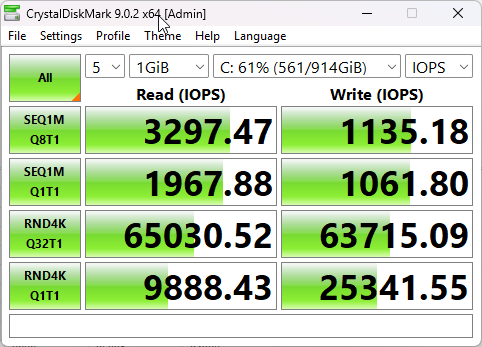
Refer to the FactoryLogix infrastructure documentation to review what is recommended: FactoryLogix Server platform specifications.
Gather SQL performance reports
From within SMSS (SQL Server Management) right click on the node in the tree and select Reports🡪Standard Reports and run each report listed below saving it as a PDF:
-
Performance - Top Queries by Average CPU Time
-
Performance - Top Queries by Average IO
-
Performance - Top Queries by Total CPU Time
-
Performance - Top Queries by Total IO
-
Performance Dashboard
-
Top Transactions by Locks Count
Right click on the database name and select Reports🡪
-
Disk Usage by Table
Gather FactoryLogix SOAP performance logging (NLog)
SOAP logging allows for monitoring of client-side system performance. The times logged are what the operator experiences within Operation and can be used to get a sense of performance on the shop floor. Aegis has changed over to a new technology for system logging called NLog, which has been proven not to impact performance while gathering the logs as much as legacy logs used through Server Management.
To activate NLogs copy the included NLog.config file to the FactoryLogix Server folder on the application server and restart the Application Service. Logs will automatically be created to C:\AegisLogs. We recommend gathering at least 3 days’ worth of typical production in the logs before sending them to Aegis.
We also have the option to transmit the NLog directly to a secure server which allows for real time monitoring by Aegis personnel. If this type of logging is more desirable, please contact Aegis Support and someone will assist with getting this setup.
Performance monitor (Perfmon) logging
Windows Performance Monitor is a powerful built-in tool that helps track and analyze system performance in real time. It provides detailed metrics on CPU, memory, disk activity, and network usage, allowing you to identify bottlenecks and understand how resources are being utilized. By collecting and reviewing this data over time, users can troubleshoot performance issues, plan capacity, and make informed decisions to optimize system and application performance, including database workloads.
Perfmon data collection should be done on the Application Service server and SQL server. To collect perfmon logs:
-
Open Performance Monitor.
-
Right-click User Defined > New >Data Collector Set.
-
Provide a Name for the set.
-
Select Browse, then select the correct template file for the server being monitored (Application vs SQL Server).
-
Select a location to save the data – Default.
Network latency test
In instances where the SQL server and the Application server reside in different physical sites, network latency may cause performance problems. One quick test that you can perform is a “ping test” from the Application Server to the Database server:
-
On the Application Server by slecting the Windows key + R, then enter CMD.
-
Enter ping, then enter the IP address of the SQL Server.
-
When the test is finished, record the Min, Max and Average times, or take a screenshot of the results.