
DPMO and opportunity count methodologies
Opportunity count methodologies define how FactoryLogix counts and calculates the number of opportunities in an assembly where a defect or other problem might occur. This calculation is used to generate Defects Per Million Opportunities (DPMO) reports and charts in FactoryLogix Analytics (DataMiner).
What is DPMO?
DPMO stands for Defects per Million Opportunities. DPMO is a key quality metric used in electronics manufacturing to measure process performance and reliability.
How is DPMO used?
DPMO is used a variety of ways in manufacturing:
Quantifying defect rates: DPMO measures how many defects occur per one million opportunities for a defect (per solder joint, component placement, or test point, for example).
Continuous improvement: Helps you identify weak points in assembly processes like SMT placement, soldering, inspection, and test.
Process comparisons: Allows you to compare quality across different products, manufacturing lines, suppliers, or time periods—even when products have different levels of complexity.
Six Sigma benchmarking: DPMO is the core metric used to calculate Sigma levels and assess how close a process is to “world-class” quality.
Reporting: Provides a standardized way to communicate quality performance to customers and stakeholders.
How is DPMO calculated?
The calculation for DPMO is described as the number of defects that occur in a process in a defined period divided by the total number of opportunities for defects that were available in that period; then the Defects per Opportunity is normalized by multiplying by 1 million:
DPMO = Number of Defects x 1,000,000 Number of Units x Number of Opportunities
A defect is defined as anything in a process that is not assembled/processed per an established criteria of quality.
An opportunity is defined as any part or process that could possibly not meet the established criteria of quality.
Electronics example
If a PCB has 1,000 solder joints and you build 1,000 boards, that’s 1,000,000 defect opportunities. If you find 200 solder defects, your DPMO is 200.
How does FactoryLogix calculate DPMO?
FactoryLogix calculates DPMO based on two methods as defined by IPC (Global Electronics Association):
The first method is IPC 7912 which is titled Calculation of DPMO & Manufacturing Indices for Printed Board Assemblies and defines how to calculate DPMO for an end item.
The second method that FactoryLogix supports natively is IPC 9261 which is titled In-process DPMO and Estimated Yield for PWAs. This method will calculate the DPMO for each process that a product is passed through.
PPM versus DPMO
Parts Per Million (PPM) is a quality measurement indicating the number of defective assemblies per million produced.
For example, if you have 25 defective pieces in a shipment of 1,000 pieces. 25/1000= .025 or 2.5% defective. . 025 X 1,000,000 = 25,000 PPM.DPMO is a more accurate, “weighted” metric that considers the complexity of the manufacturing process.
To calculate DPMO, you take the number of defects divided by the number of defect opportunities, multiplied by 1,000,000.
DPMO Example
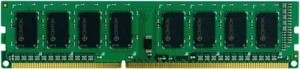
Example Board A is a computer Memory Module with 61 placements
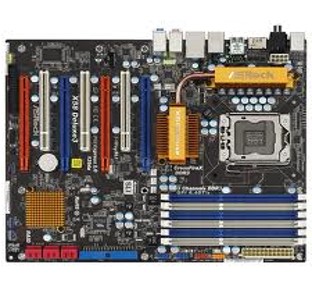
Example Board B is a computer Motherboard with 3,492 placements
The total opportunities for Examples A and B are shown for all population points: a routing station where parts are actually placed/inserted on the PCBs. In this example, a mere three defects found on one assembly per job will result in significantly different end-product DPMO calculations (IPC-7912A) for the two PCBs. Assuming a job quantity of 10 boards in each case, the DPMO results would be:
Example Board A: DPMO = (3/(10*835))*1000000. End-Product DPMO: 359.3
Example Board B: DPMO = (3/(10*22660))*1000000. End-Product DPMO: 13.2
IPC-7912A (end product DPMO)
Calculation of DPMO for an end item (finished product)
Considers all parts in a CAD file
Why it’s useful:
Normalizes defect rates across products and processes of different complexity
Provides a common language for quality performance
Helps track quality trends over time
Supports benchmarking between sites or suppliers
Aligns with Six Sigma practices where lower DPMO means higher maturity
IPC-9261 (in process DPMO)
Calculation of DPMO for each operation in the manufacturing route
Considers chargebacks in defect collection in order to assist in determining the root cause of a defect
Provides a clear indication of processes in need of improvement
Why it’s useful:
Standard benchmarking: You can compare in-process quality across lines, products, or factories using a common metric.
Process improvement: By tracking where defects occur and their relative frequency, you can focus continuous improvement efforts where they’ll have the greatest impact.
Estimated yield: Allows you to estimate how likely assemblies are to pass future inspections based on current process performance.
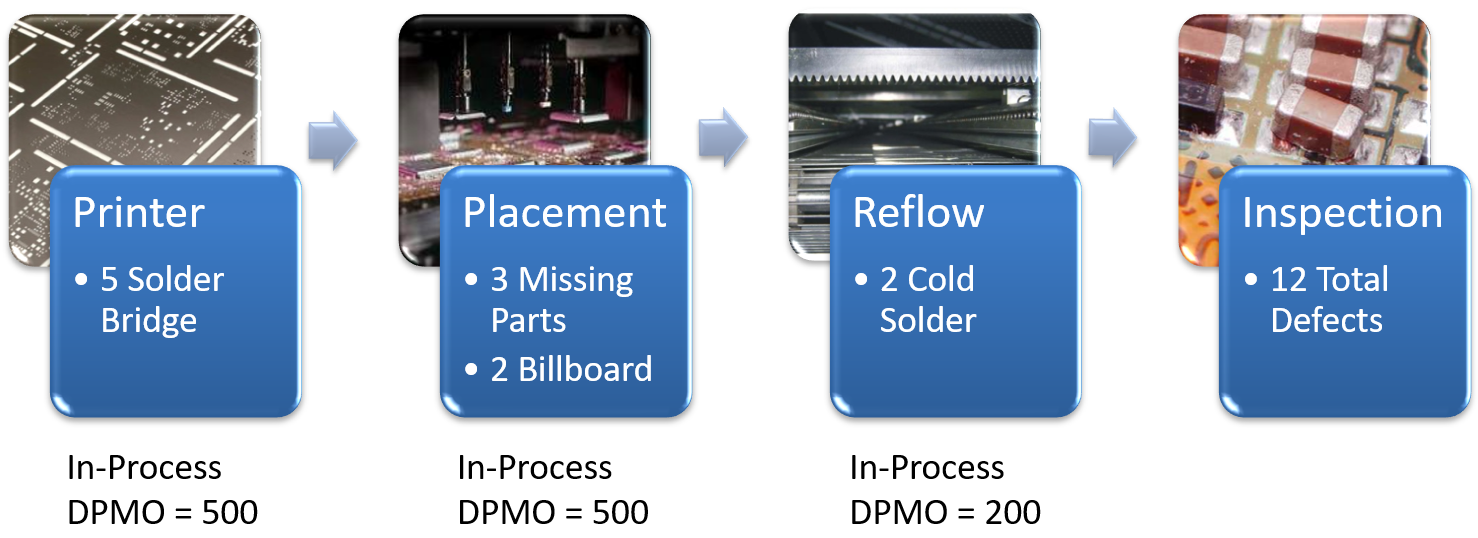
Chargeback example
In this example, using In-Process DPMO (IPC-9261), the specific processes likely responsible for the defects in question are indicated. For this example, assume 1000 opportunities and a Job Quantity of 10. The DPMO results are shown in the following illustration.
Related topics |
|---|